Portfolio
Predicting Psychiatric Readmission Rate Based on Clinical Notes

Rapid psychiatric readmissions present a burden for both the patients as well as the hospitals. Due to the difficulties in assessing mental health status and complications inherent to mental illnesses, premature discharges as well as rapid decay of mental status after discharge is an issue many psychiatric facilities faces. We aim to create a BERT-based model that can assist clinicians in identifying patients as risk of psychiatric readmission upon discharge as well as extract abstract relationships from discharge summaries. Furthermore, as an attempt to understand the level of representation learning achieved by BERT, we visualized the attention (or connection) between two word tokens within BERT embeddings and were surprised to see that these connections actually make sense.
Models: LSTM with GloVe embedding, BERT (base) and BERT pre-trained on discharge notes.
Food Happens in Vegas: How can restaurants improve their Yelp profiles for success?

The goals of this data mining project is to 1/ redefine success on Yelp and 2/ identify key attributes that are associated with a successful Yelp profile using feature importance. Our findings can help restaurants improve their Yelp profile to become more appealing to users.
Our methodology defines “success” as a binary variable through an exploratory analysis of the restaurants’ review counts and ratings on Yelp. Feature variables include categories and attributes that Yelp users can use to select which restaurant to visit. For this project, we ran Decision Tree, Random Forest, and Logistic Regression to explore key features associated with “success” and obtain recommendations for restaurants to improve their Yelp profile.
Models: Decision Tree, Random Forest, and Logistic Regression.

Goodreads Book Recommender System in Spark

Leveraging the power of Spark in processing big data, this project aims to build a comprehensive book recommender system that could infer readers’ preferences from their reading history on Goodreads.
I built a collaborative filtering recommender system, which utilizes a user-item association matrix and can be described by a small set of latent factors. For example, based on one user's feedback to certain items, the model will recommend books that similar users might like (user-based) or recommend similar items that the first user might be interested in (item-based).
To this goal, I used Alternating Least Squares algorithm (ALS) , which factorizes the user-item matrix into the product of two rectangular matrices of lower dimensions. In particular, ALS model finds k-dimensional feature vectors for each user-item, also known as k-latent factors, such that the dot product of feature vectors approximates the user’s rating for that item. For evaluation, I used two primary evaluation metrics: precision at k & normalized discounted cumulative gain (NDCG). I also used UMAP and t-SNE to visualize how items are distributed in the learned space.
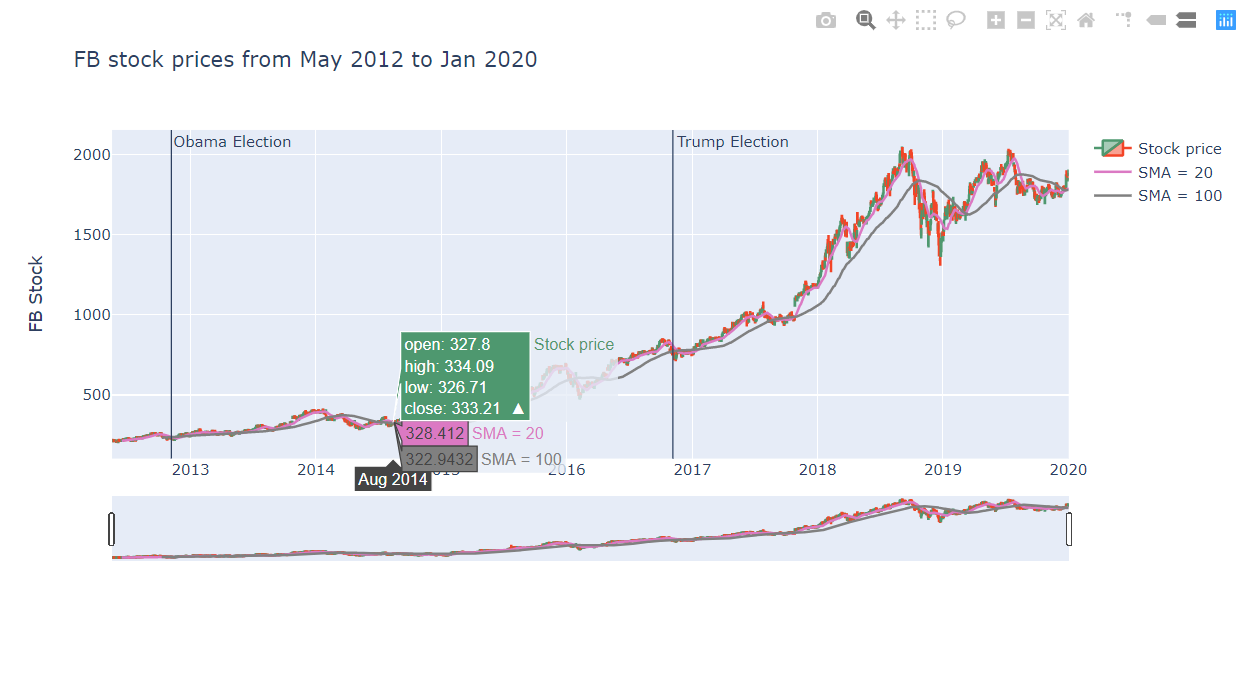
Effects of US Presidential Elections on the stock market: a close look into the Tech sector


This project analyzes stock prices of big tech companies, Facebook - Apple - Amazon - Netflix - Google (FAANG) and sees how they progressed throughout the two recent presidential election (2012 - Barack Obama and 2017 - Donald Trump).
Some interesting findings: 1) Overall, stocks within the FAANG companies are closely correlated; 2) Facebook and Google stocks were the most volatile in 2018, the year when Facebook had its infamous scandal with Cambridge Analytica; 3) Several tech stocks rocketed after Trump's elecion in 2017.
Models: Auto-regressive (AR), Moving average (MA), ARIMA (Autoregression integrated with moving-average) model.
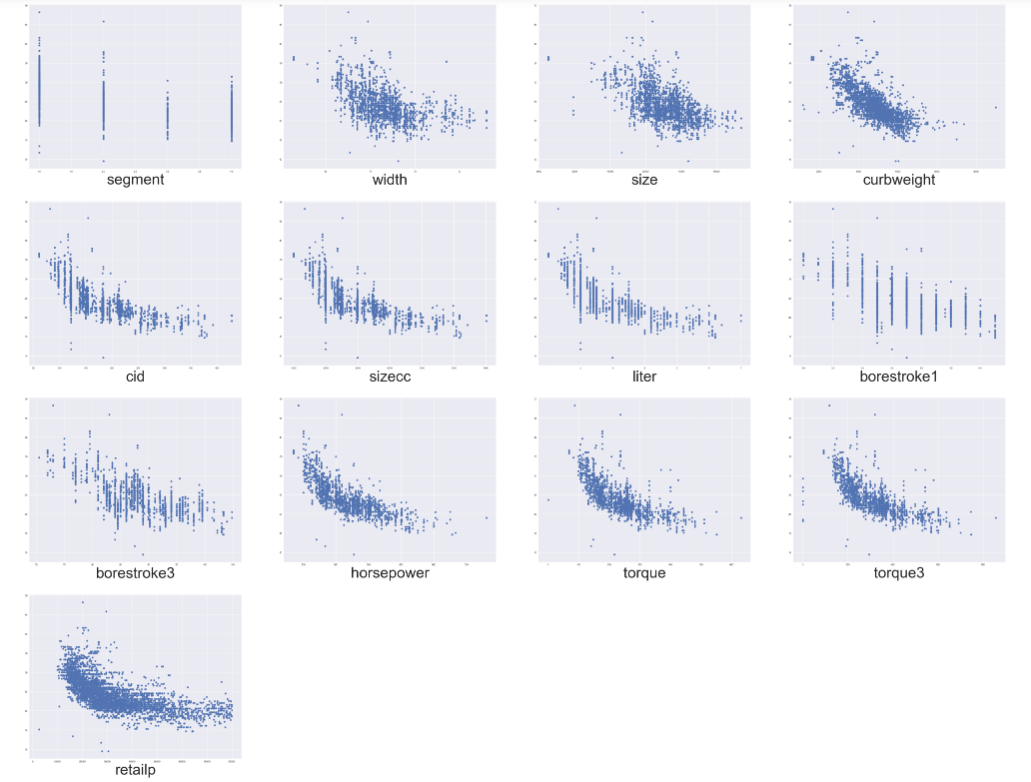
Product Differentiation in the Automobiles Market: An Empirical Analysis
This research project examined the quality vs. fuel-efficiency trade-offs between low-end and high-end car models. I first consolidated a cross-sectional dataset of 10,000+ observations (2005–2014) and 22 variables from 3 sources. I then developed a Double-Log Regression model to estimate the average miles-per-gallon of an automobile model based on its design features and real market price.
For feature engineering, I conducted Pearson’s correlation test to detect and reduce multi-collinearity problem; used year-fixed effects to avoid serial correlation.
Models: Linear Regression, Lin-Log and Double-Log models.
Results: Final R_squared: 0.7984 | Final MSE: 0.0024.
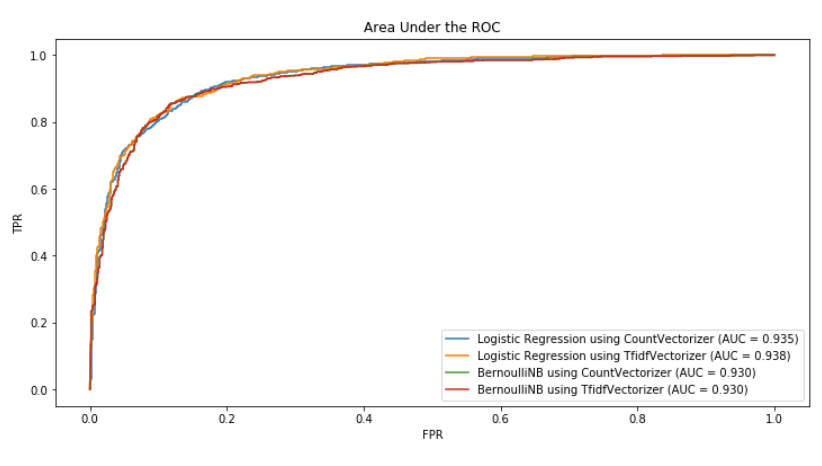
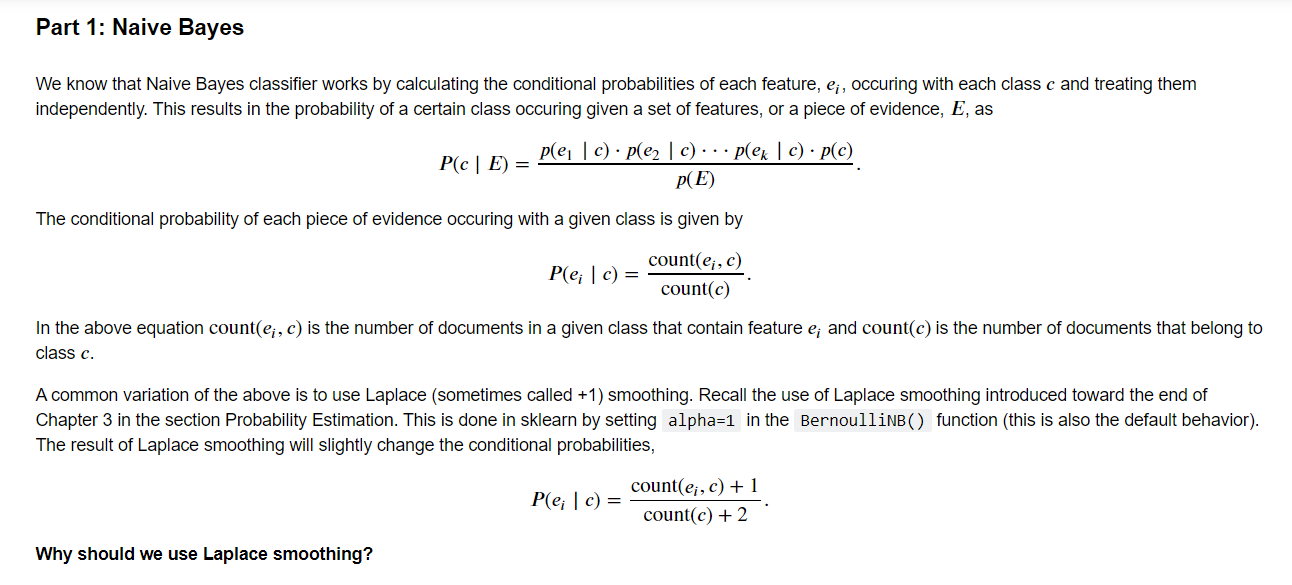
Sentiment Analysis on Movie Reviews: Logistic Regression vs. Naive Bayes Bernoulli
This notebook will compare the performance of two NLP techniques, Count Vectorizor and TF-IDF Vectorizer, and two classification models, Logistic Regression and Bernoulli Naive Bayes in sentiment analysis. I'll give detailed explanation on which model performs better and why.
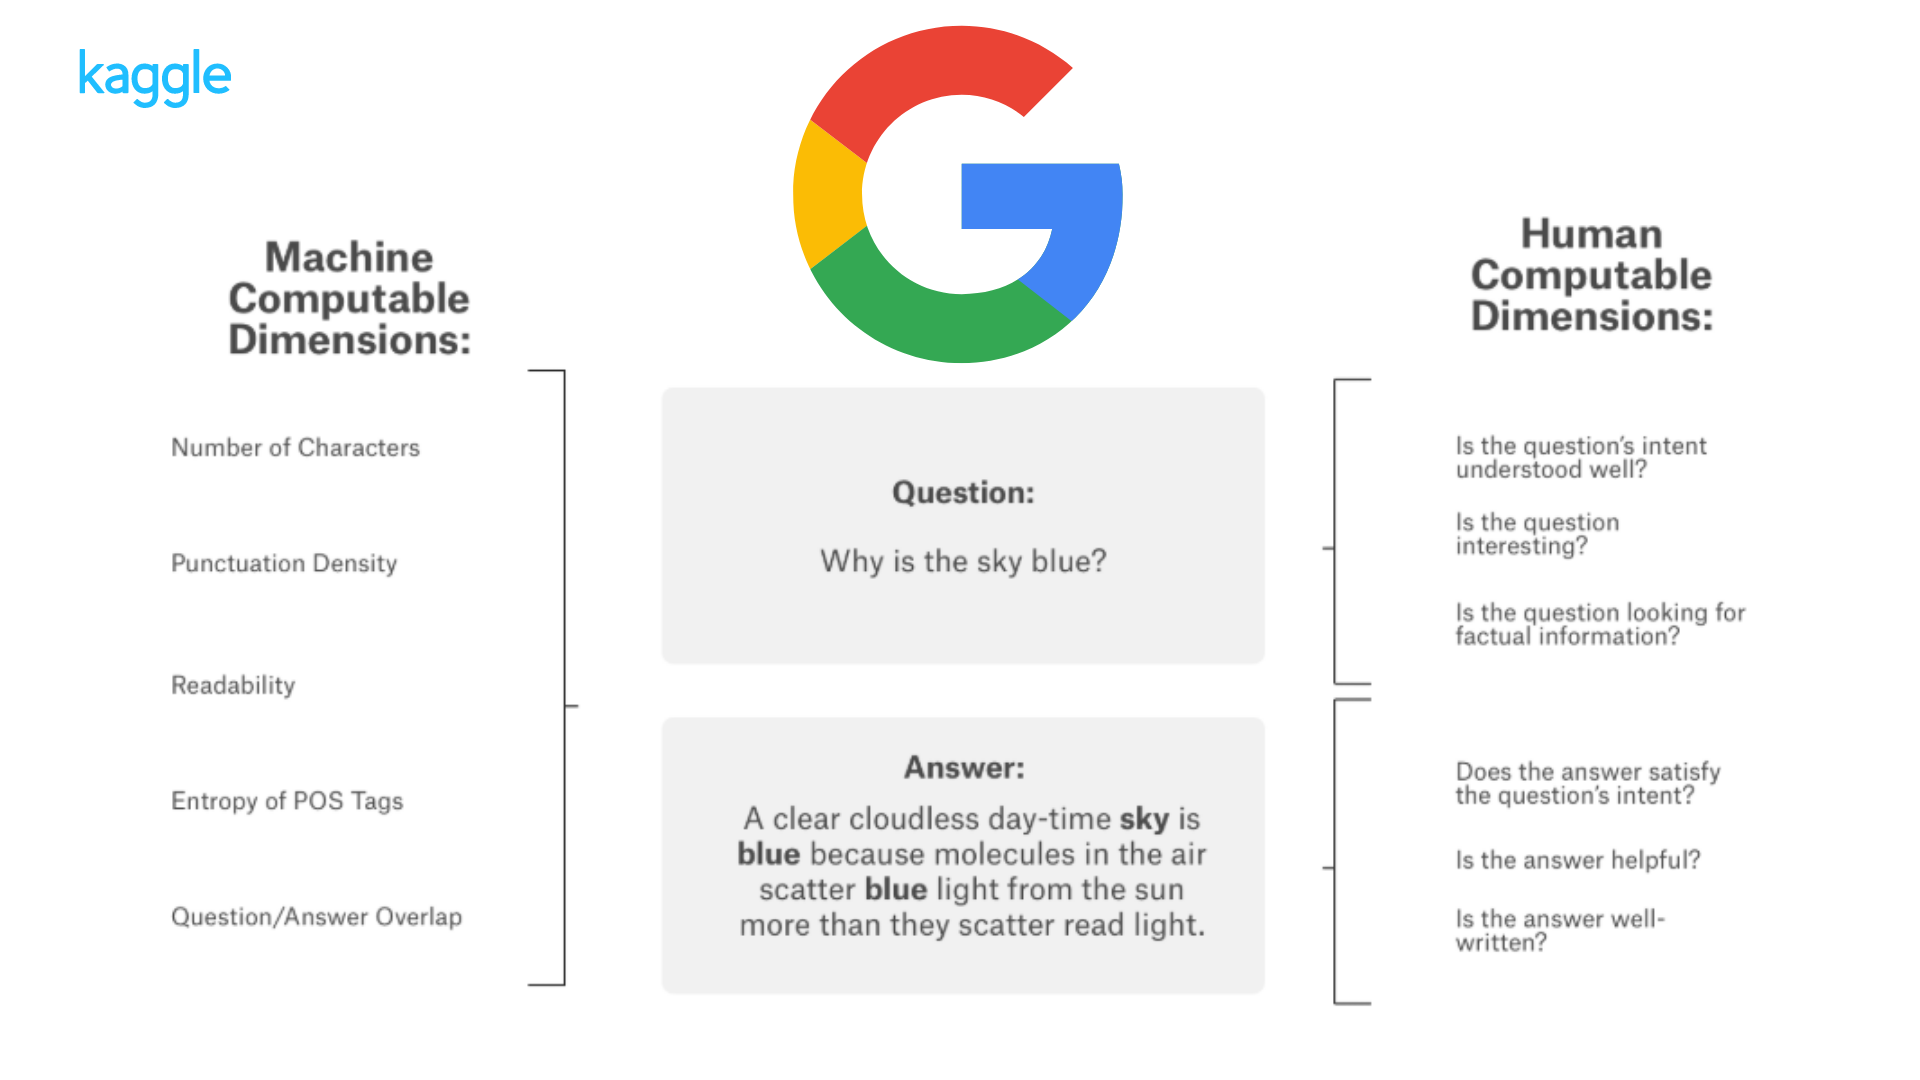
Kaggle Competition: Google QUEST Q&A Labelling


Google Q&A Labelling is a classification problem. Given pairs of questions and answers, we are asked to classify the question types, answer types, level of helpfulness of the answers, etc. For this project, I conducted comprehensive EDA to understand the datasets and important variables, used Multilabel Stratified KFolds to solve class imbalance issue, and used BERT pretuned models to solve the classification problems.
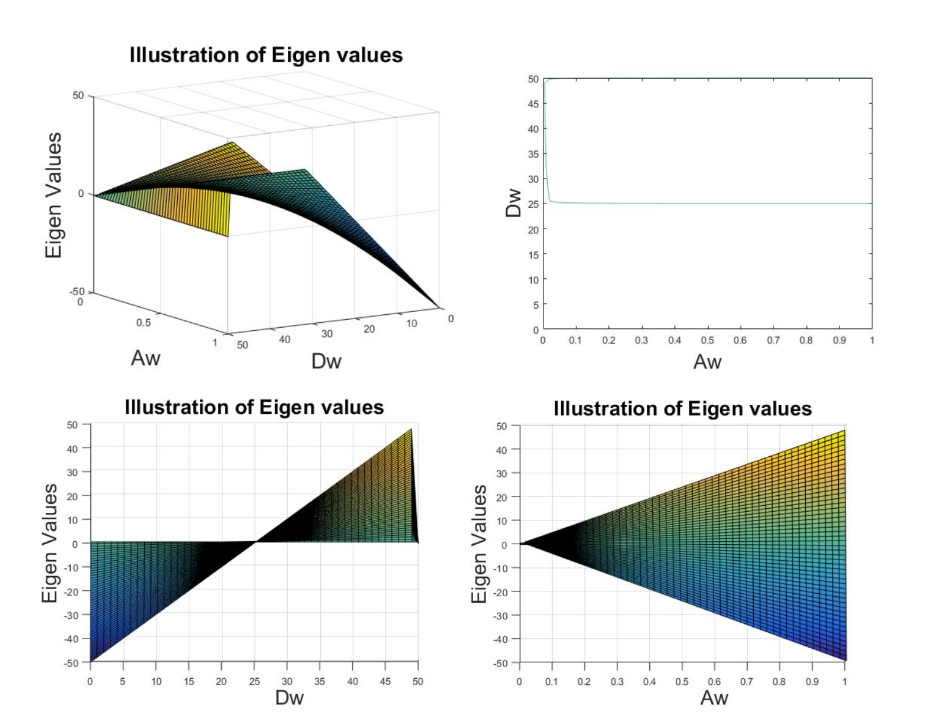
Projected growth of Neurendocrine cells using Matlab

The project aims at tracking the three phase transformation of neuroendocrine cells specific to the human colon. A stem cell transforms into a progenitor cell and finally a mature cell through symmetric and asymmetric cell division. Symmetric cell division, also known as self-renewal, occurs when a stem cell divides symmetrically into two identical stem cells. Asymmetric cell division characterizes the maturation process when a stem cell divides into a stem cell and a progenitor cell, or a progenitor cell divides into a progenitor cell and a mature cell. In each phase, cells also experience apoptosis. meaning cell death. With an aim to capture this phenomenon, I want to build a model that track the number of cells in each phase, stem cells, progenitor cells and mature cells.